
XYplot
Created Montag 18 Juni 2018
Allows to animate one or two graphs with respect to time. Gives a instantaneous insight into complex systems.
1. Purpose
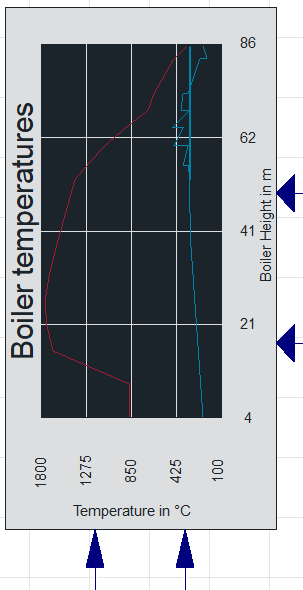
A common example is to display the spatial distribution of quantity, e.g. boiler temperatures vs. boiler height.
2. Usage
- Drag and drop an instance of XYplot to your model.
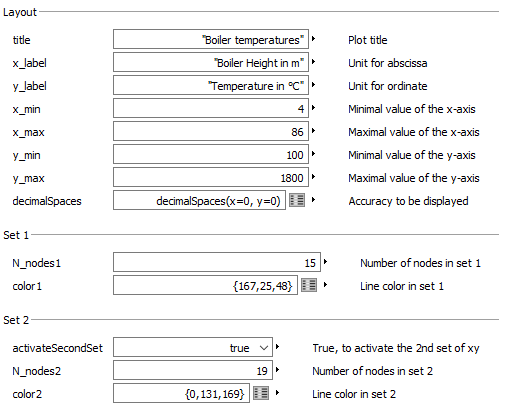
- Parameterise the parameters according to your needs (see figuer below for an example). Pay attention to N_nodes1 and N_nodes2 as they refer to the number of the two curves' nodes.
- wire 2 x 2 sets of vector inputs to be displayed. For instance you can use arrays of components of Modelica.Blocks.Sources.RealExpression for that.
- see ClaRa.Examples.SteamPowerPlant_01 and ClaRa.Visualisation.Check.TestXYplot for two example applications.
3. Revisions
- 23.02.2018 - v. 1.0 - initial implementation - Friedrich Gottelt, XRG Simulation GmbH
- 18.06.2018 - v. 1.1 - bugfixed dimension of input x2 - Friedrich Gottelt, XRG Simulation GmbH