
Visualisation
Created Montag 22 Februar 2016
An animated bar that expands and shrinks according to its input.
1. Purpose
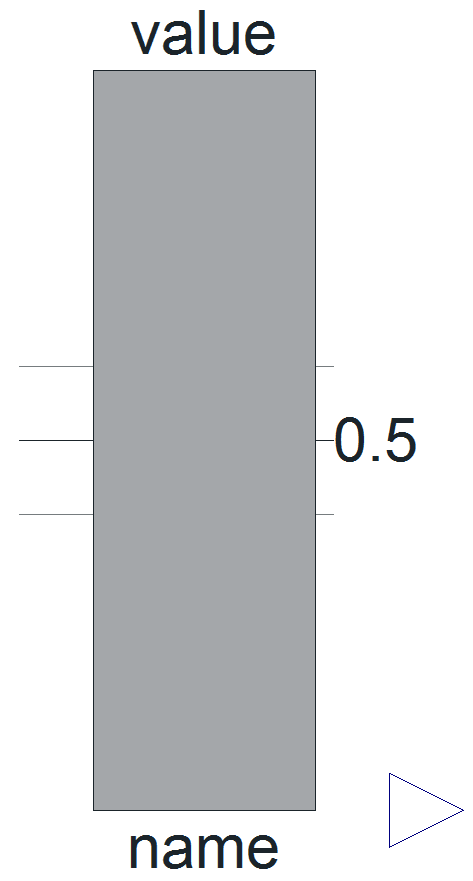
The idea is to visualise variables and to highlight values that are above or below a specific high and low value, respectively. When the input is above the high limit then the bar is coloured red and turn blue when the value falls below the low limit. If the input is between these two limits the bar will be green.
2. Usage
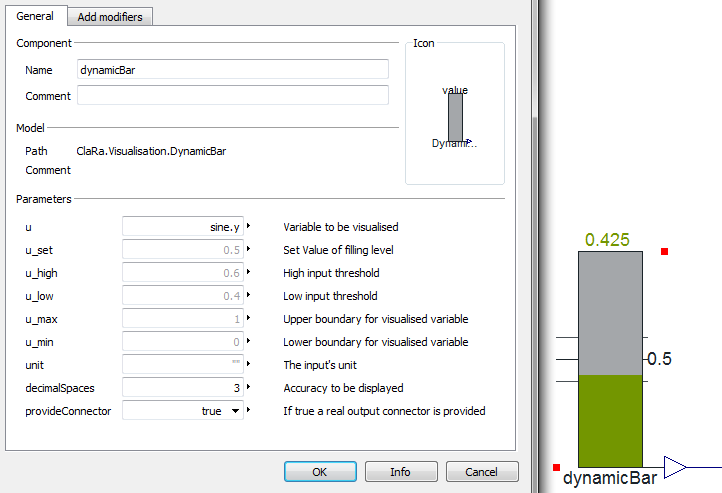
The usage is as illustrated below: The input is defined in the parameter dialog amongst the other parameters. If provideConnector is set to true then a Real output connector is provided. This connector can be used to couple the value to a controller for example. In this sense the model is an alternative to the Modelica standard libraries' RealExpression.
3. Revisions
- 22.02.2016 - v1.1.1 - initial implementation - Jan Braune (Hamburg Technical University), Friedrich Gottelt (XRG SImulation GmbH)